


Here’s something that should pique your interest in Google Analytics A/B testing.
I’m sure you’ve heard of the game The Sims-3. The makers wanted to drive more people to register for the game, and they felt that the value proposition was an area that needed some tweaking.
Let’s look at what A/B testing did for their business.
The original page looked like this (variation A):

The above page (A) was slightly changed to look like the page below (variation B):

The results were simply amazing! With an increased emphasis on the word “Free,” game registrations shot up by a whopping 128%.
The Sims-3 makers would have never known the power of this change unless they had taken advantage of A/B testing with Google Analytics.
I’m sure I now have your attention. You’ve probably already decided to start testing your website, but do you know how to go about A/B testing changes on your site?
There are several tools out there that can aid you in A/B testing. The one that’s free and highly effective is Google Analytics, which also brings you the Content Experiment tool. In this article, I’ll provide a step-by-step guide for using Google Analytics for A/B testing.
What is A/B Testing Used For?
First things first, you’ll need to know what A/B testing can shed light on.
A/B tests can be run to analyze several visual aspects of your website depending on which areas you’re testing.
Are you looking at a single conversion or multiple conversion goals? A/B testing allows you to zero in on the design and message elements that will be most effective in wooing your target audience.
Of course, the ultimate aim is to optimize your conversion rates…and your revenue.
Let me explain this further.
You can put your best design forward and receive immediate astounding results. You see traffic pouring into your website and your subscription rate shoots up, too. But then you realize that the sales rate isn’t great, which dents your revenue.
Your dilemma in this case is obvious.
Do you stick with your stellar design? The answer is “no.” You need something that contributes to your bottom line positively.
If your best design has been part of the Google Analytics A/B testing and has not contributed positively to your revenue, you’ll have to let go of it for the one that generates the most business.
What Constitutes a Conversion For You?
Well, it could be anything.
If you’re a blogger, it’s email subscriptions. On the other hand, for an eCommerce website, this could be something as small as a click, or something as major as a sale. Conversions could be other things like newsletter signups, subscriptions, or adding a product to a shopping cart.
This means that defining your goals for Google Analytics A/B testing is incredibly important.
Defining the Goal
Setting your goals beforehand will help you decide on the page design that works. Once you do that, you can move forward with the Google Analytics A/B testing and the Content Experiment tool as mentioned earlier.
You should know that Google Content Experiment has a somewhat different format than A/B testing and split testing. It uses an A/B/N mode where you can test up to 10 full versions of a single page. Each one is delivered to users from a separate URL.
Locating the Tool in Google Analytics
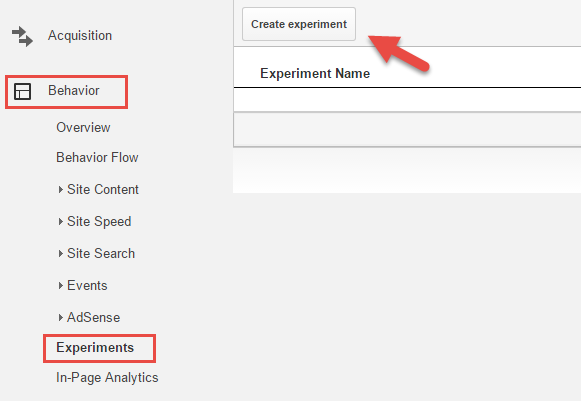
All you need to do is go to “Behavior” and then “Experiments,” as illustrated in the image below. Here you’ll find the button for “Create experiment.”
You’ll then name the experiment descriptively so that identification is simple later. Your goal could be to A/B test a call-to-action button or a sign-up form. Whatever it is, ensure that your experiment name is easily identifiable and something you’ll remember later.
Now, move to the “objective for this experiment” part. Here you’ll define the metric that you’ll be utilizing to gauge the Google Analytics A/B testing results. You can choose from an array of metrics, including goals, site usage, AdSense, eCommerce, and the like.
Below is a short description on how to choose the right metric:
• Adsense: Select this metric to improve impressions or ad clicks.
• eCommerce: If your goal is to improve revenue or transactions, choose this option.
• Goal: This metric is picked when you want to test page clicks, session duration, destination pages, or event attendance.
• Site Usage: If you’re trying to measure user experience, use this metric to take page views or time spent on the website as a parameter.
You can also choose more than one metric simultaneously. This action makes Google Analytics A/B testing even more effective.
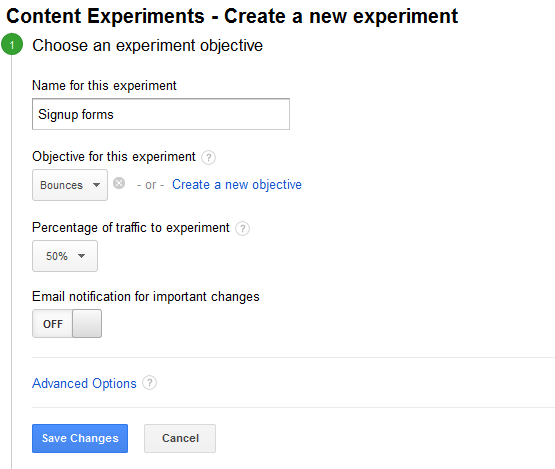
Time to Dedicate Traffic for the Experiment
At this point you need to divide a portion of your website traffic for your experiment. This apportionment determines the ratio of people who will see the test pages as opposed to the original page.
If you’re expecting quick results, I suggest that you dedicate a high percentage of traffic towards the experiment. Of course, I wouldn’t suggest this if the experiment poses a few risks to your business.
Also, to remain in tune with the small changes that occur during Google Analytics A/B testing, be sure to turn the email notification on.
How to Distribute the Traffic
Click on the “advanced options” button. This will allow you to divide traffic by turning on the “distribute traffic” toggle.
Ensure that you direct equal amounts of traffic to each variation of the experimental pages. If you choose not to enable this option, the “Content Experiment” tool will go ahead and follow its default behavior. This involves distributing the traffic on an ongoing basis, depending on the variation performance.
For meaningful results, I recommend setting the experiment for a duration of at least three weeks.
The Confidence Threshold
This is why I consider Google Analytics A/B testing a trustworthy tool. It allows you to fix a confidence threshold for the A/B test. In other words, you can set a minimum confidence level that a variant page has to achieve in order to be announced as the winner. Not having any of the variants reach this threshold would mean all versions are a failure.
If you’ve set a high threshold, you’ll be more confident that the winning variation truly makes a difference. The point to be noted here is that a high threshold can require the experiment to be run for a longer period of time.
Configuring the Experiment and Code
It’s now time to configure the Google Analytics A/B testing Content Experiment. You’ll begin by adding your original web page and the experimental variants. Doing this is pretty effortless since all you need to do is add in the URLs as shown below. Then, take a look at the preview image for confirmation.
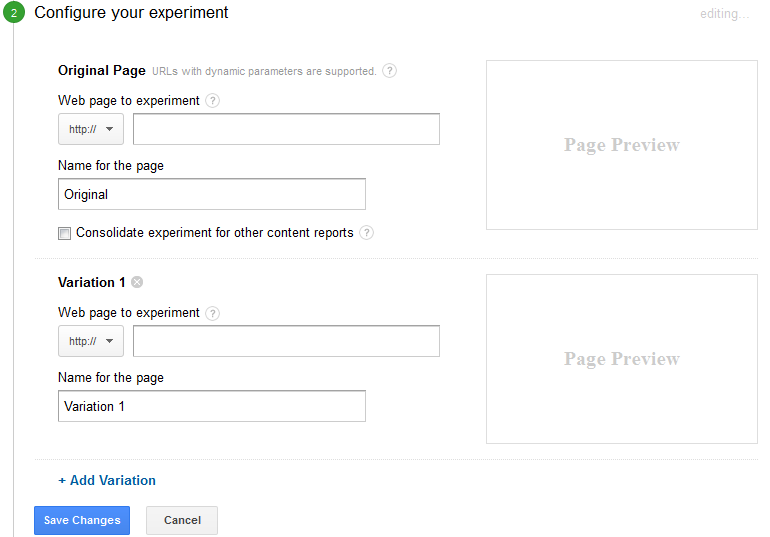
Once you’re done adding the original and test pages as well as previewing the images, click on “save.” You’ve successfully configured the experiment! Congratulations! But, you’ll now need to organize the experiment code.
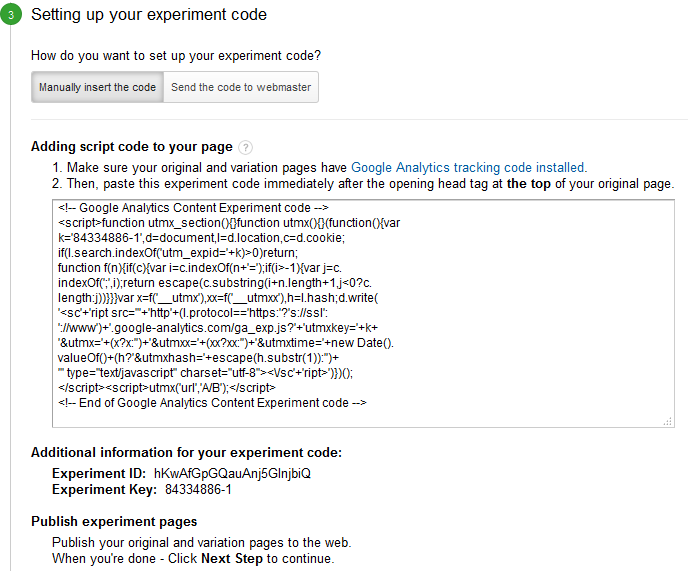
Provided that the Google Analytics tracking codes have been installed properly on your variant pages and the original page, the codes would be visible in the box instantly.
Upon opening the head tag on the top of the original webpage, place the code immediately. Once that’s done click on “save changes” and proceed to the next step, which is the final one.
Review and Start the Experiment!
To make the whole exercise fool-proof, Google Analytics will validate the process once you’ve added the code. If any errors have been encountered, those will be highlighted. Sometimes, I’ve seen that Google Analytics fails to find the codes. In this case, you can skip the validation step.
However, ensure that this is only the last resort. Double check that your page is free of any errors before dismissing the validation step.
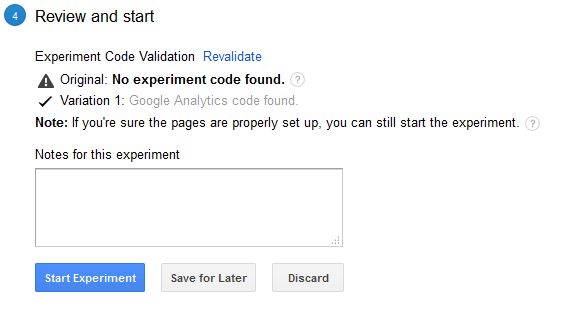
If all goes well, the Google Analytics A/B testing tool will show you the checkered flag which means the race begins. You’ll begin seeing the data within as little as two days.
Checking the Results
The experiment will run its course. At the end of it, Google Analytics will declare the winner.
The choice of the winner is going to be entirely based on the metrics that you set in place previously. Of course, the confidence threshold will also come into picture now.
Ideally, the process takes about three weeks, or a bit more than that. Eventually, you’ll have your “star” page right in front of you. This design will be the one that’s been most effective with your visitors.
Need Help?
When using the above outlined steps, you’ll hardly encounter any problem during the whole process, but I understand that you might need some extra guidance. I’m always here to answer your questions and lend a hand. Leave your comments below and I’ll help with your Google Analytics A/B testing. Happy experimentating to you!
About the Author
 Shane Barker is a digital marketing consultant, named the #1 social media consultant in the nation by PROskore Power Rankings. He has expertise in business development, online marketing and is an SEO specialist who has consulted with Fortune 500 companies, government agencies, and a number of A-list celebrities.